
ENERGY EFFICIENCY
Turn energy data into efficiency decisions
ExpertPower turns meter data into clear efficiency insights, helping teams compare consumption, uncover inefficient areas, and prioritize savings opportunities across branches, buildings, production areas, systems, and metered loads.
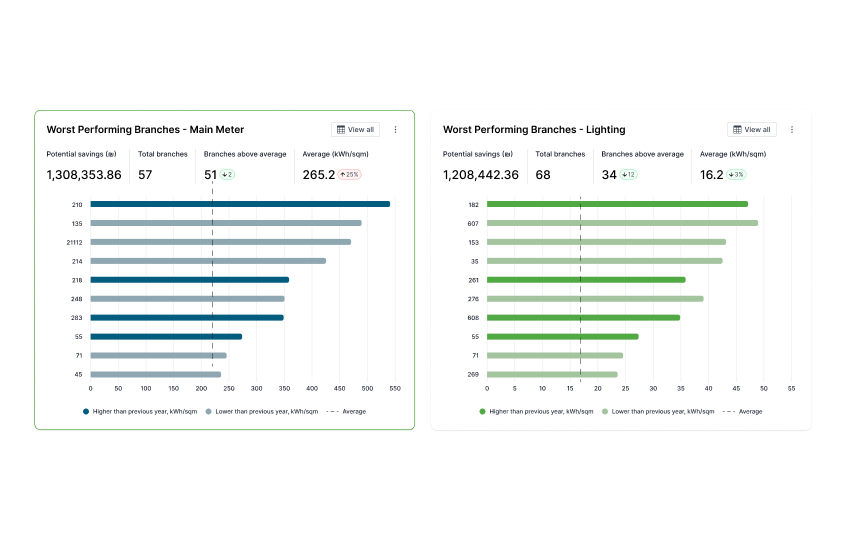
Find where energy is wasted - and where savings start
ExpertPower normalizes consumption data to uncover inefficiencies, detect unusual patterns, and prioritize the highest-impact savings opportunities.
- Compare energy performance across sites, branches, meters, or usage categories
- Normalize consumption by area, branch size, or operational profile
- Identify best and worst performers at a glance
- Quantify potential energy and cost savings
- Track improvements over time with clear performance trends
Benchmark similar areas with meaningful comparisons
Evaluate performance against the right baseline, across branches, buildings, production areas, systems, and metered loads.
- Compare similar locations, assets, or operational areas side by side
- Segment by branch size, building type, area, or consumption profile
- Identify best and worst performers within each peer group
- Use normalized metrics such as consumption per square meter
- Spot recurring usage patterns across hours, days, or seasons
- Drill down into the locations or metered loads driving inefficient performance
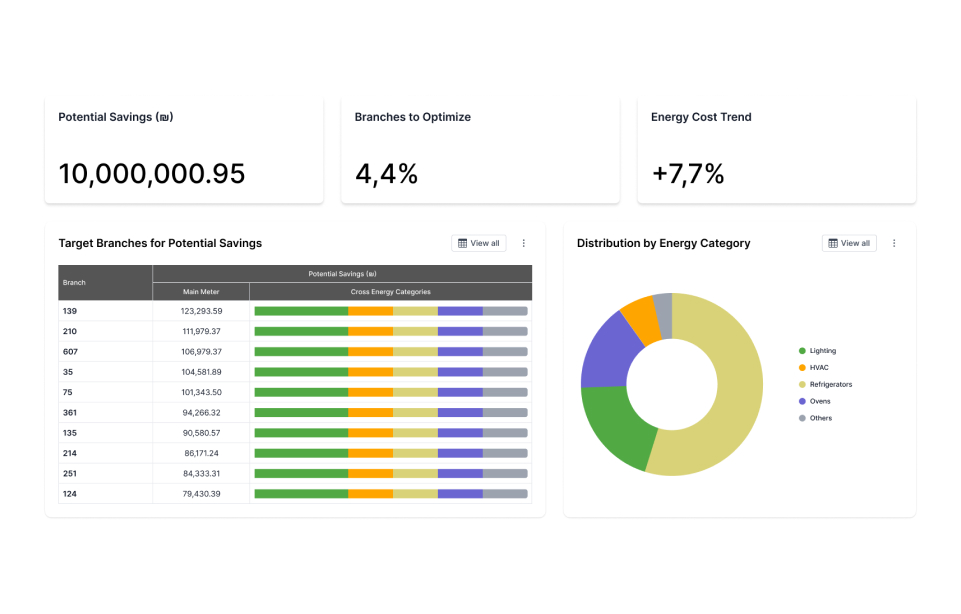
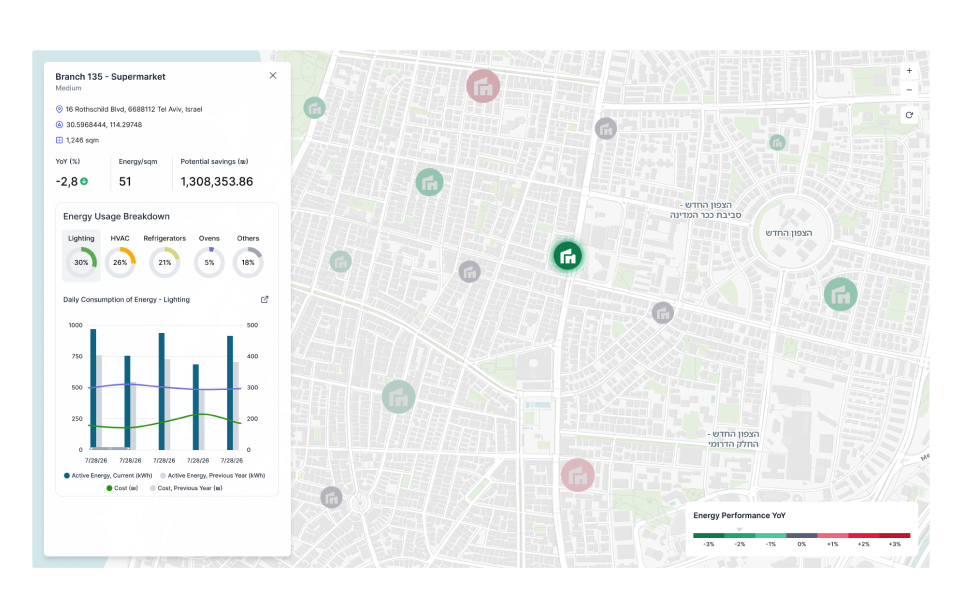
Find the highest-impact energy savings opportunities
Move from analysis to action by identifying where improvement efforts can deliver the greatest financial impact.
- Calculate potential energy and cost savings
- Prioritize locations, areas, and loads by savings potential
- Use heat maps to highlight the highest-impact areas for improvement
- Compare performance year over year, monthly, weekly, or daily
- Identify morning, evening, mid-day, or flat usage patterns
- Detect unusual behavior before it becomes recurring waste
WHAT ENERGY EFFICIENCY DOES
Key energy efficiency capabilities
Everything you need to compare performance, uncover savings potential, and prioritize the improvements that matter most.
Area-to-area comparison
Compare performance across locations, buildings, or metered loads using consistent efficiency metrics.
Period-over-period comparison
Compare the same location, building, or load over time to track daily, weekly, monthly, seasonal, or year-over-year changes.
Normalized consumption
Analyze usage with normalized values such as kWh per square meter for fair, meaningful comparisons.
Peer group segmentation
Group similar branches, areas, or assets by size, type, usage profile, or operational characteristics.
Best & worst performers
Quickly identify the highest- and lowest-performing areas within each comparison group.
Savings potential ranking
Prioritize locations, areas, and loads by estimated savings opportunity.
Heat map visualization
Highlight high-impact efficiency opportunities using clear visual heat maps.
Peak behavior analysis
Identify when and where consumption peaks occur, and whether they reflect expected operations or inefficiency.
Reports & Excel export
Export data and insights for analysis, reporting, and follow-up.